
Measurement of Success of the Credit Card Fraud Detection ML Model
Let’s review one of the most common use cases of machine learning (“ML”) algorithms – credit card fraud detection and measure its success in reducing losses.
The problem is a natural fit for ML because of the following characteristics:
- A large number of transactions occur every second of the day
- A real or fraudulent transaction can occur in any part of the world for any purpose
- Each transaction is identified as real or fraud (the target) after it is completed
- Every fraudulent transaction has real costs and customer service headaches for card issuers, merchants, and customers alike
- Fraudulent transactions are a very small portion (less than 0.05%) of the total number of transactions. Correctly identifying them is akin to finding a needle in a haystack
In theory, it would be quite easy to deploy the best performing ML algorithm (as determined by whatever metric used) given the vast amount of labeled dataset available at every financial institution (“FI”). The FIs should see a meaningful reduction in fraud-related losses from the very next day!
Theoretical Model Performance
Here is the model performance on test data. This model was trained on about 280,000 transactions.
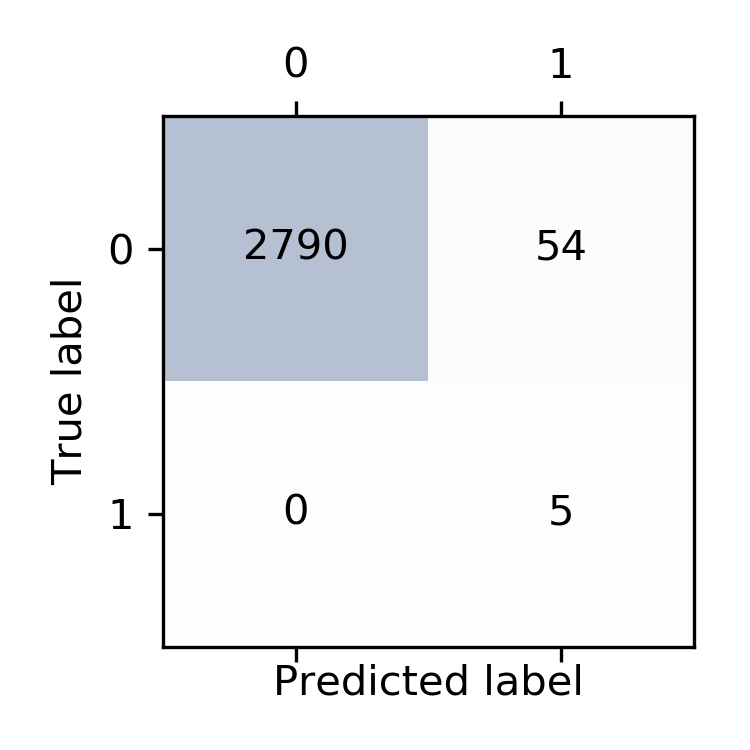
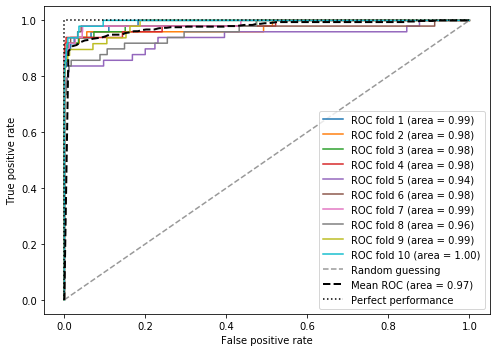
Yes, the confusion matrix is not the best metric for evaluating the performance of ML algorithms on datasets containing unbalanced samples, but this model was specifically configured to adjust for it. Here are the ROC curves. The model is good to go.
Assuming that the FI executed the project well and deployed this model into production, the model should produce meaningful savings right away. Over time, as the model is updated by training it on new data, fraud-related losses should drop to near zero.
Analysis of Success
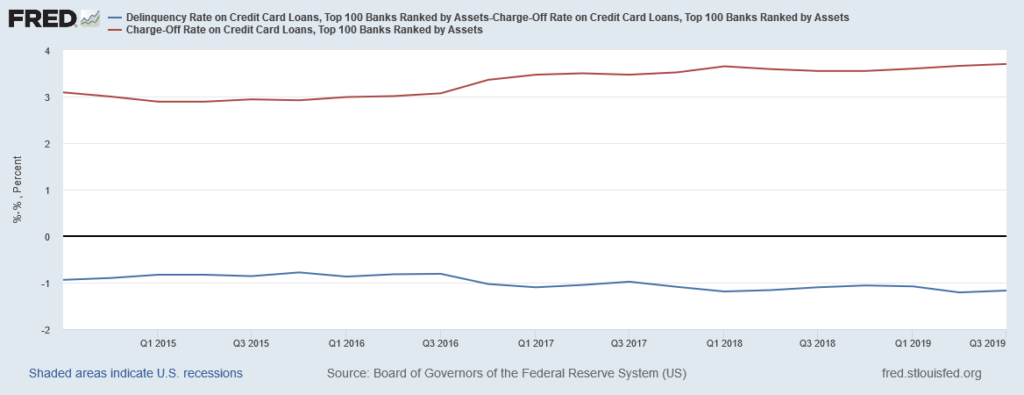
Since credit card ML project success metrics are proprietary, we can calculate overall success by performing analysis on aggregate data. Typically, credit card delinquencies (“DQ”) turn into charge-offs (“CO”) within 90 days. Thus, a “simple” success measurement metric could be CCFraud = (Charge-Off – Delinquencies). Note: If the FIs didn’t have meaningful losses due to fraud, then DQ >= CO by definition.
The chart below shows the quarterly DQ rate on credit card loans by the top 100 banks (red line) and the difference between DQ and CO (blue line=DQ-CO). The blue line is both negative and stable. It also never gets close to zero. This shows that portfolio CO is greater than DQ (probably due to fraudulent transactions and other items). Additionally, the stability of the blue line shows that the FIs have achieved the minimum possible fraud level (probably by applying really expensive technology) and models are unable to reduce it any further.
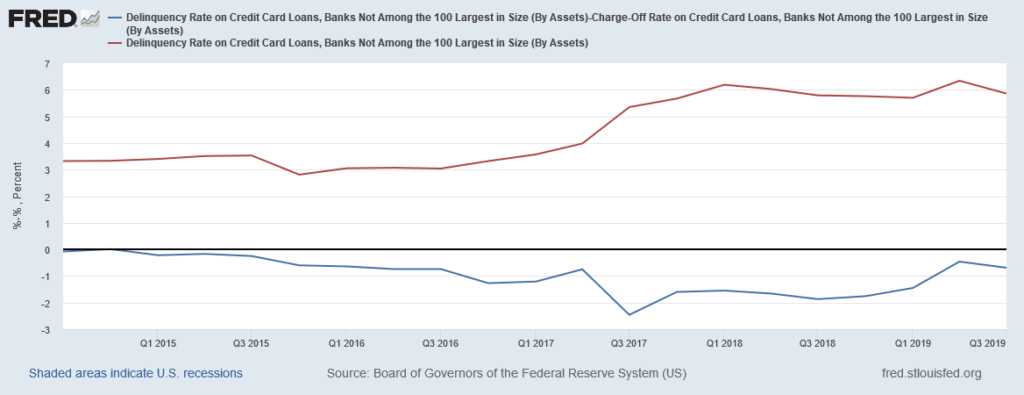
Let’s look at another chart showing the quarterly DQ rate on credit card loans by banks other than the top 100 (regional and community banks). As shown below, there is certainly more volatility in DQ and CO, but also notice that the difference between DQ and CO (our estimate of fraud) has significantly more volatility when compared to the same ratio for the top 100 banks. One can guess (confidently) that the smaller banks are either not using ML technology or not updating their ML models in a timely fashion.
Conclusion
The ML application by the top 100 banks is certainly able to reduce credit card loan charge-offs, however, they are not able to eliminate them. Institutions in other than the top 100 banks can benefit from adding ML models into their workflow or updating any ML applications they already have. Both, types of institutions can reduce losses further by incorporating one or all the recommended solutions.